California Healthy Places Index and Alcohol Outlet Dashboard
Purpose
This dashboard is meant to serve as an interactive platform for data provided by the Public Health Alliance of Southern California in their Healthy Places Index (HPI) and associated indicators of community characteristics (Public Health Alliance of Southern California, 2022). HPI indicators consist of metrics related to economic, educational, social, transportation, neighborhood, housing, environmental, demographic, healthcare, and health facets of the populations and regions analyzed. An HPI map interface already exists and can be visited using this link. This dashboard is meant to facilitate the analysis of HPI data in conjunction with alcohol outlet data in Los Angeles County Census Tracts.
It is well understood that alcohol availability negatively impacts both the individual and the community. At the individual level, alcohol use and availability primarily impact health and safety by increasing rates of chronic diseases, congenital disabilities, and injuries (Centers for Disease Control and Prevention, 2022; Fone et al., 2016; Gruenewald et al., 2002; Pollack et al., 2005; Snedker & Herting, 2008). At the community level, an increase in alcohol use and availability correlates to increased crime rates, reduces community health, and attracts undesirable gatherings under the assortative drinking theory (Foster et al., 2017; Horsefield et al., 2023; Lipton et al., 2013; Tabb et al., 2018; Trangenstein et al., 2020). The association between alcohol outlets and the indicators included in the HPI warrant further analysis of the data alongside outlet data.
Data
The HPI 3.0 data for this dashboard was obtained via email correspondence with the Climate Change and Health Data Lead of the Public Health Alliance of Southern California (Bodenreider, 2023). The alcohol outlet data was obtained from the California Alcoholic Beverage Control (2022) website and geocoded using ArcGIS Pro.
Functionality
The dashboard comprises five tabs: the Scatterplot, Kernel Density (KDE) Map, Choropleth Map, Regression Plot, and Interactive Map (Folium) Tabs. The dashboard's design intends to facilitate easy and efficient analysis without rerunning the code to evaluate different metrics. In alignment with the goals of the dashboard, all tabs contain dropdown menus and buttons to initiate the generation of outputs. The interactive map tab also hosts text input boxes.
GitHub Gist: HPI and Alcohol Outlet Dashboard
Scatterplot Tab
The Scatterplot Tab hosts two dropdown menus containing the HPI indicators and a generation button. Users can view all potential variable options, make their selections and then use the generate button to initiate plot drawing. The purpose behind the generation button is to avoid continuous redrawing of the plot each time a user selects a new indicator in one dropdown. The generation button links to the Regression Plot Tab so that as the scatterplot updates, the regression plot will as well for ease of analysis. The scatterplot tab displays the observations of the selected variables within the plot. Observations are colored based on their alcohol outlet count value.
KDE Map Tab
The Kernel Density (KDE) Map tab hosts one dropdown menu containing the various alcohol outlet type options: Bars (On-Site Consumption), Restaurants (On-Site Consumption), Beer & Wine (Packaged, Off-Site Consumption), Beer, Wine, & Spirits (Packaged, Off-Site Consumption), and All Outlet Types. The user selection filters the alcohol outlet locations used in the KDE calculation, and a static map is produced within the tab. The functionality of this tab allows for ease of evaluation of the density differences of various outlet types.
Choropleth Map Tab
The Choropleth Map Tab contains a dropdown for users to select an HPI indicator to evaluate via choropleth mapping. The tab also hosts a button to initiate the program's map generation using the variable selected in the dropdown menu. This tab allows users to visualize how the variable values are spatially distributed across Census tracts in Los Angeles County.
Regression Plot Tab
The Regression Plot Tab contains two dropdown menus containing the HPI indicator options and the outlet count variable, as well as a button to facilitate the initiation of the plot generation. The indicator selections and generation button connect to the Scatterplot Tab to facilitate ease of viewing both forms of analysis for the variables selection while reducing redundancy of entering in variable selection in both tabs. The regression plot provides a statistical measure of the relationship between variables. The regression plot uses linear regression with a 95% confidence interval.
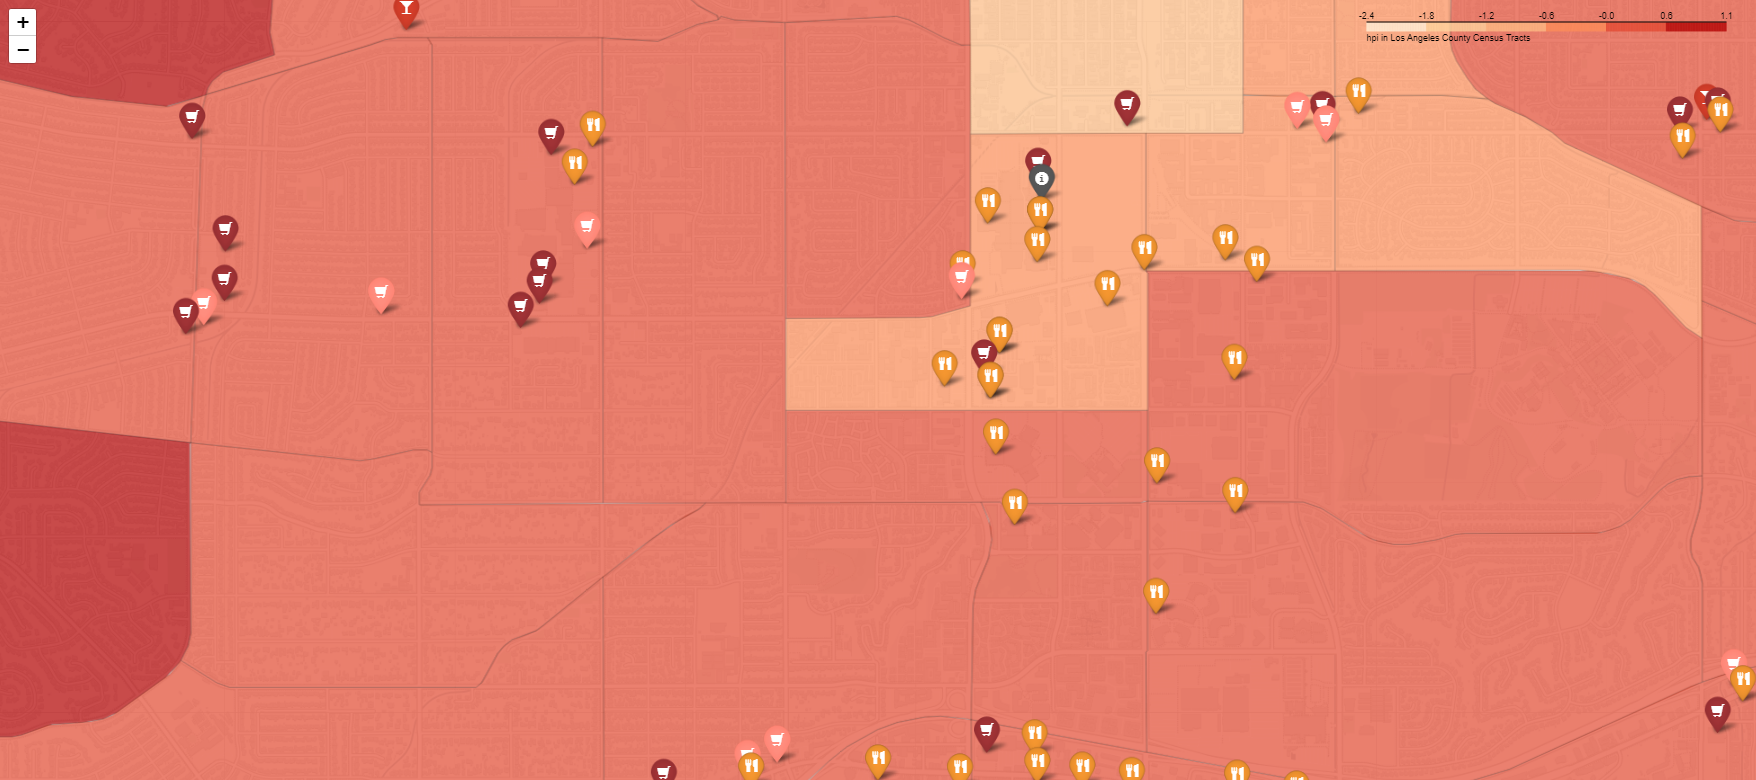
Interactive Map Tab
The Interactive Map Tab serves are a customizable analysis feature using Folium. The tab hosts two input text boxes for users to enter an address within Los Angeles County and specify a radius distance. The address input is geocoded and used alongside the radius distance input to obtain and display alcohol outlets within the resulting buffer. Alcohol outlets are added to the map as markers. The outlet markers are color-coded and assigned an icon and a type name for display. The tab also hosts a dropdown menu containing the HPI indicator and outlet count variables for choropleth mapping of the Los Angeles County Census tracts behind the outlets within the buffer. Popups for the outlet markers provide users with information about each outlet, including the business name, address, and license type. Tooltips for Census tracts provide information on the Census tract number, population, value of the indicator selected from the dropdown menu, and outlet count. This tab allows for the visual analysis of how outlets are distributed and how outlets relate to various indicators.

Scatterplot Tab

KDE Map Tab

Choropleth Map Tab

Regression Plot Tab

Interactive Map Tab
References
Bodenreider, C. (2023, February 13). HPI Data File Request.
California Alcoholic Beverage Control. (2022). Licenses by County and Census Tract. https://www.abc.ca.gov/licensing/licensing-reports/licenses-by-county-and-census-tract/
Centers for Disease Control and Prevention. (2022). Drinking too much alcohol can harm your health. Learn the facts | CDC. Centers for Disease Control and Prevention. https://www.cdc.gov/alcohol/fact-sheets/alcohol-use.htm
Fone, D., Morgan, J., Fry, R., Rodgers, S., Orford, S., Farewell, D., Dunstan, F., White, J., Sivarajasingam, V., Trefan, L., Brennan, I., Lee, S., Shiode, N., Weightman, A., Webster, C., & Lyons, R. (2016). Change in alcohol outlet density and alcohol-related harm to population health (CHALICE): A comprehensive record-linked database study in Wales. Public Health Research, 4(3), Article 3. https://doi.org/10.3310/phr04030
Foster, S., Hooper, P., Knuiman, M., Trapp, G., & Wood, L. (2017). Does alcohol outlet density differ by area-level disadvantage in metropolitan Perth? Drug and Alcohol Review, 36(5), 701–708. https://doi.org/10.1111/dar.12469
Gruenewald, P. J., Remer, L., & Lipton, R. (2002). Evaluating the Alcohol Environment: Community Geography and Alcohol Problems. Alcohol Research & Health, 26(1), 42–48.
Horsefield, O. J., Lightowlers, C., & Green, M. A. (2023). The spatial effect of alcohol availability on violence: A geographically weighted regression analysis. Applied Geography, 150, 102824. https://doi.org/10.1016/j.apgeog.2022.102824
Lipton, R., Yang, X., A. Braga, A., Goldstick, J., Newton, M., & Rura, M. (2013). The Geography of Violence, Alcohol Outlets, and Drug Arrests in Boston. American Journal of Public Health, 103(4), 657–664. https://doi.org/10.2105/AJPH.2012.300927
Pollack, C. E., Cubbin, C., Ahn, D., & Winkleby, M. (2005). Neighbourhood deprivation and alcohol consumption: Does the availability of alcohol play a role? International Journal of Epidemiology, 34(4), 772–780. https://doi.org/10.1093/ije/dyi026
Public Health Alliance of Southern California. (2022). Frequently Asked Questions. California Healthy Places Index. https://www.healthyplacesindex.org/faqs
Snedker, K. A., & Herting, J. R. (2008). The Spatial Context of Adolescent Alcohol Use*. In Y. F. Thomas, D. Richardson, & I. Cheung (Eds.), Geography and Drug Addiction (pp. 43–63). Springer Netherlands. https://doi.org/10.1007/978-1-4020-8509-3_4
Tabb, L. P., Fillmore, C., & Melly, S. (2018). Location, location, location: Assessing the spatial patterning between marijuana licenses, alcohol outlets and neighborhood characteristics within Washington state. Drug and Alcohol Dependence, 185, 214–218. https://doi.org/10.1016/j.drugalcdep.2018.01.004
Trangenstein, P. J., Gray, C., Rossheim, M. E., Sadler, R., & Jernigan, D. H. (2020). Alcohol Outlet Clusters and Population Disparities. Journal of Urban Health, 97(1), 123–136. https://doi.org/10.1007/s11524-019-00372-2