Foundational Remote Sensing Concepts: Las Vegas Imagery
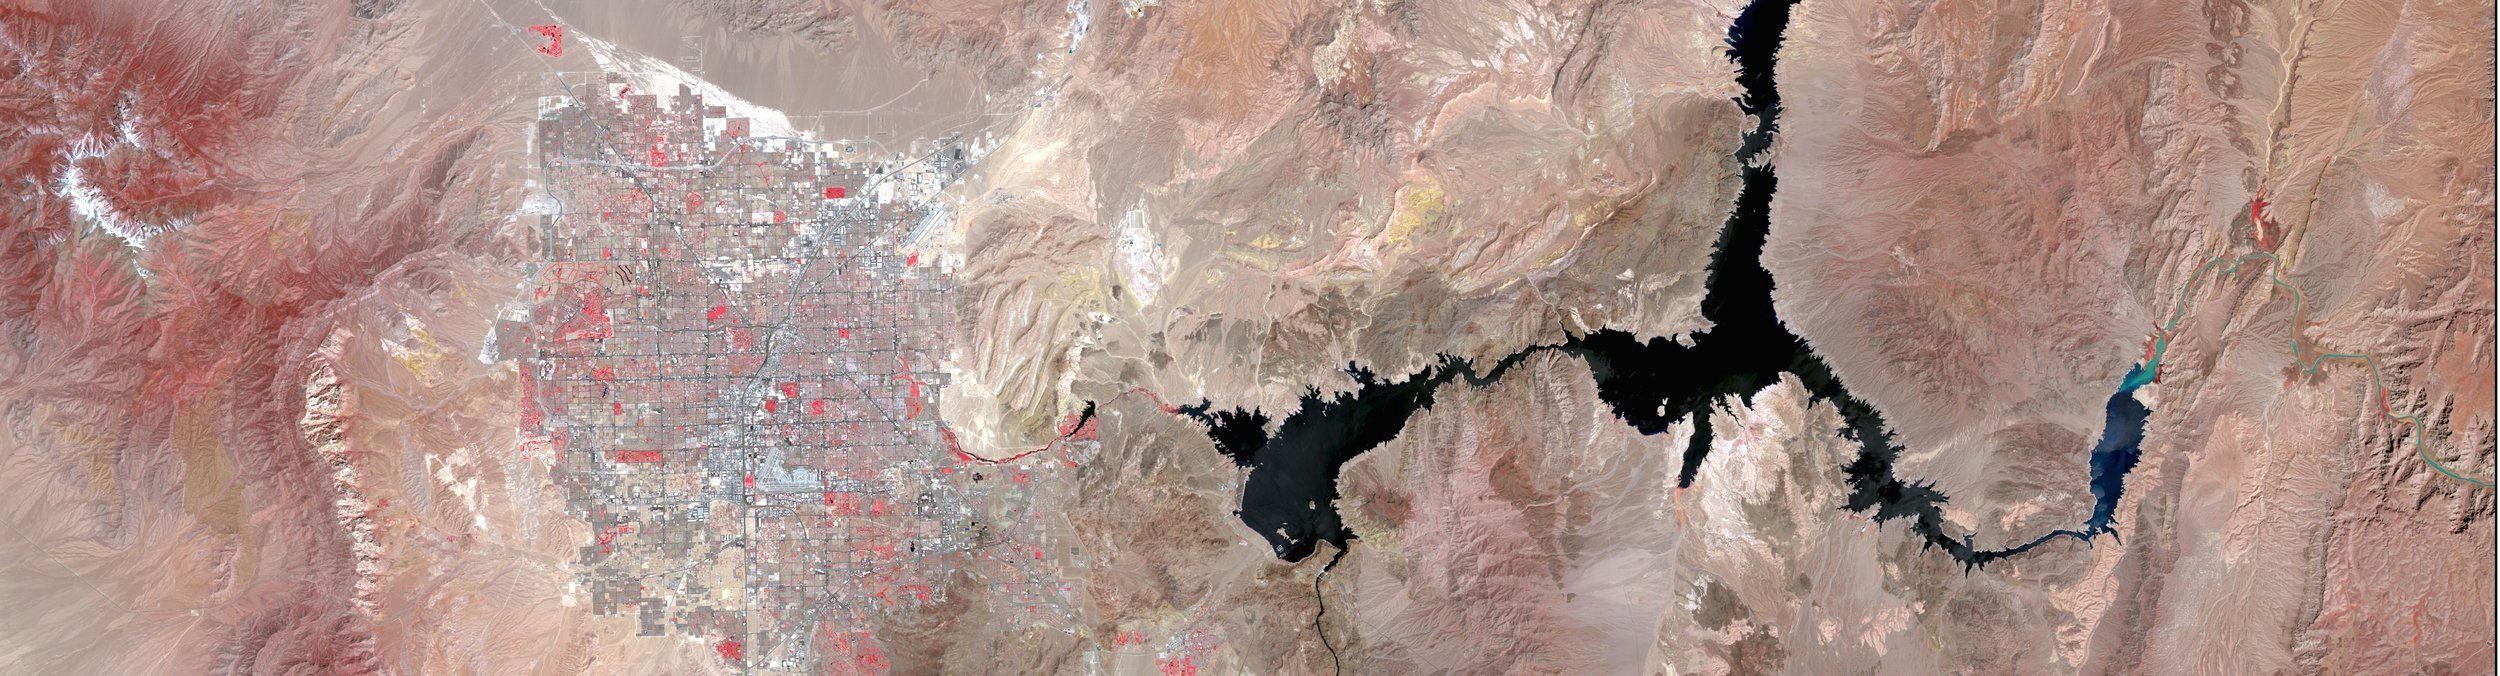
Exploring Satellite Imagery: Las Vegas, Nevada
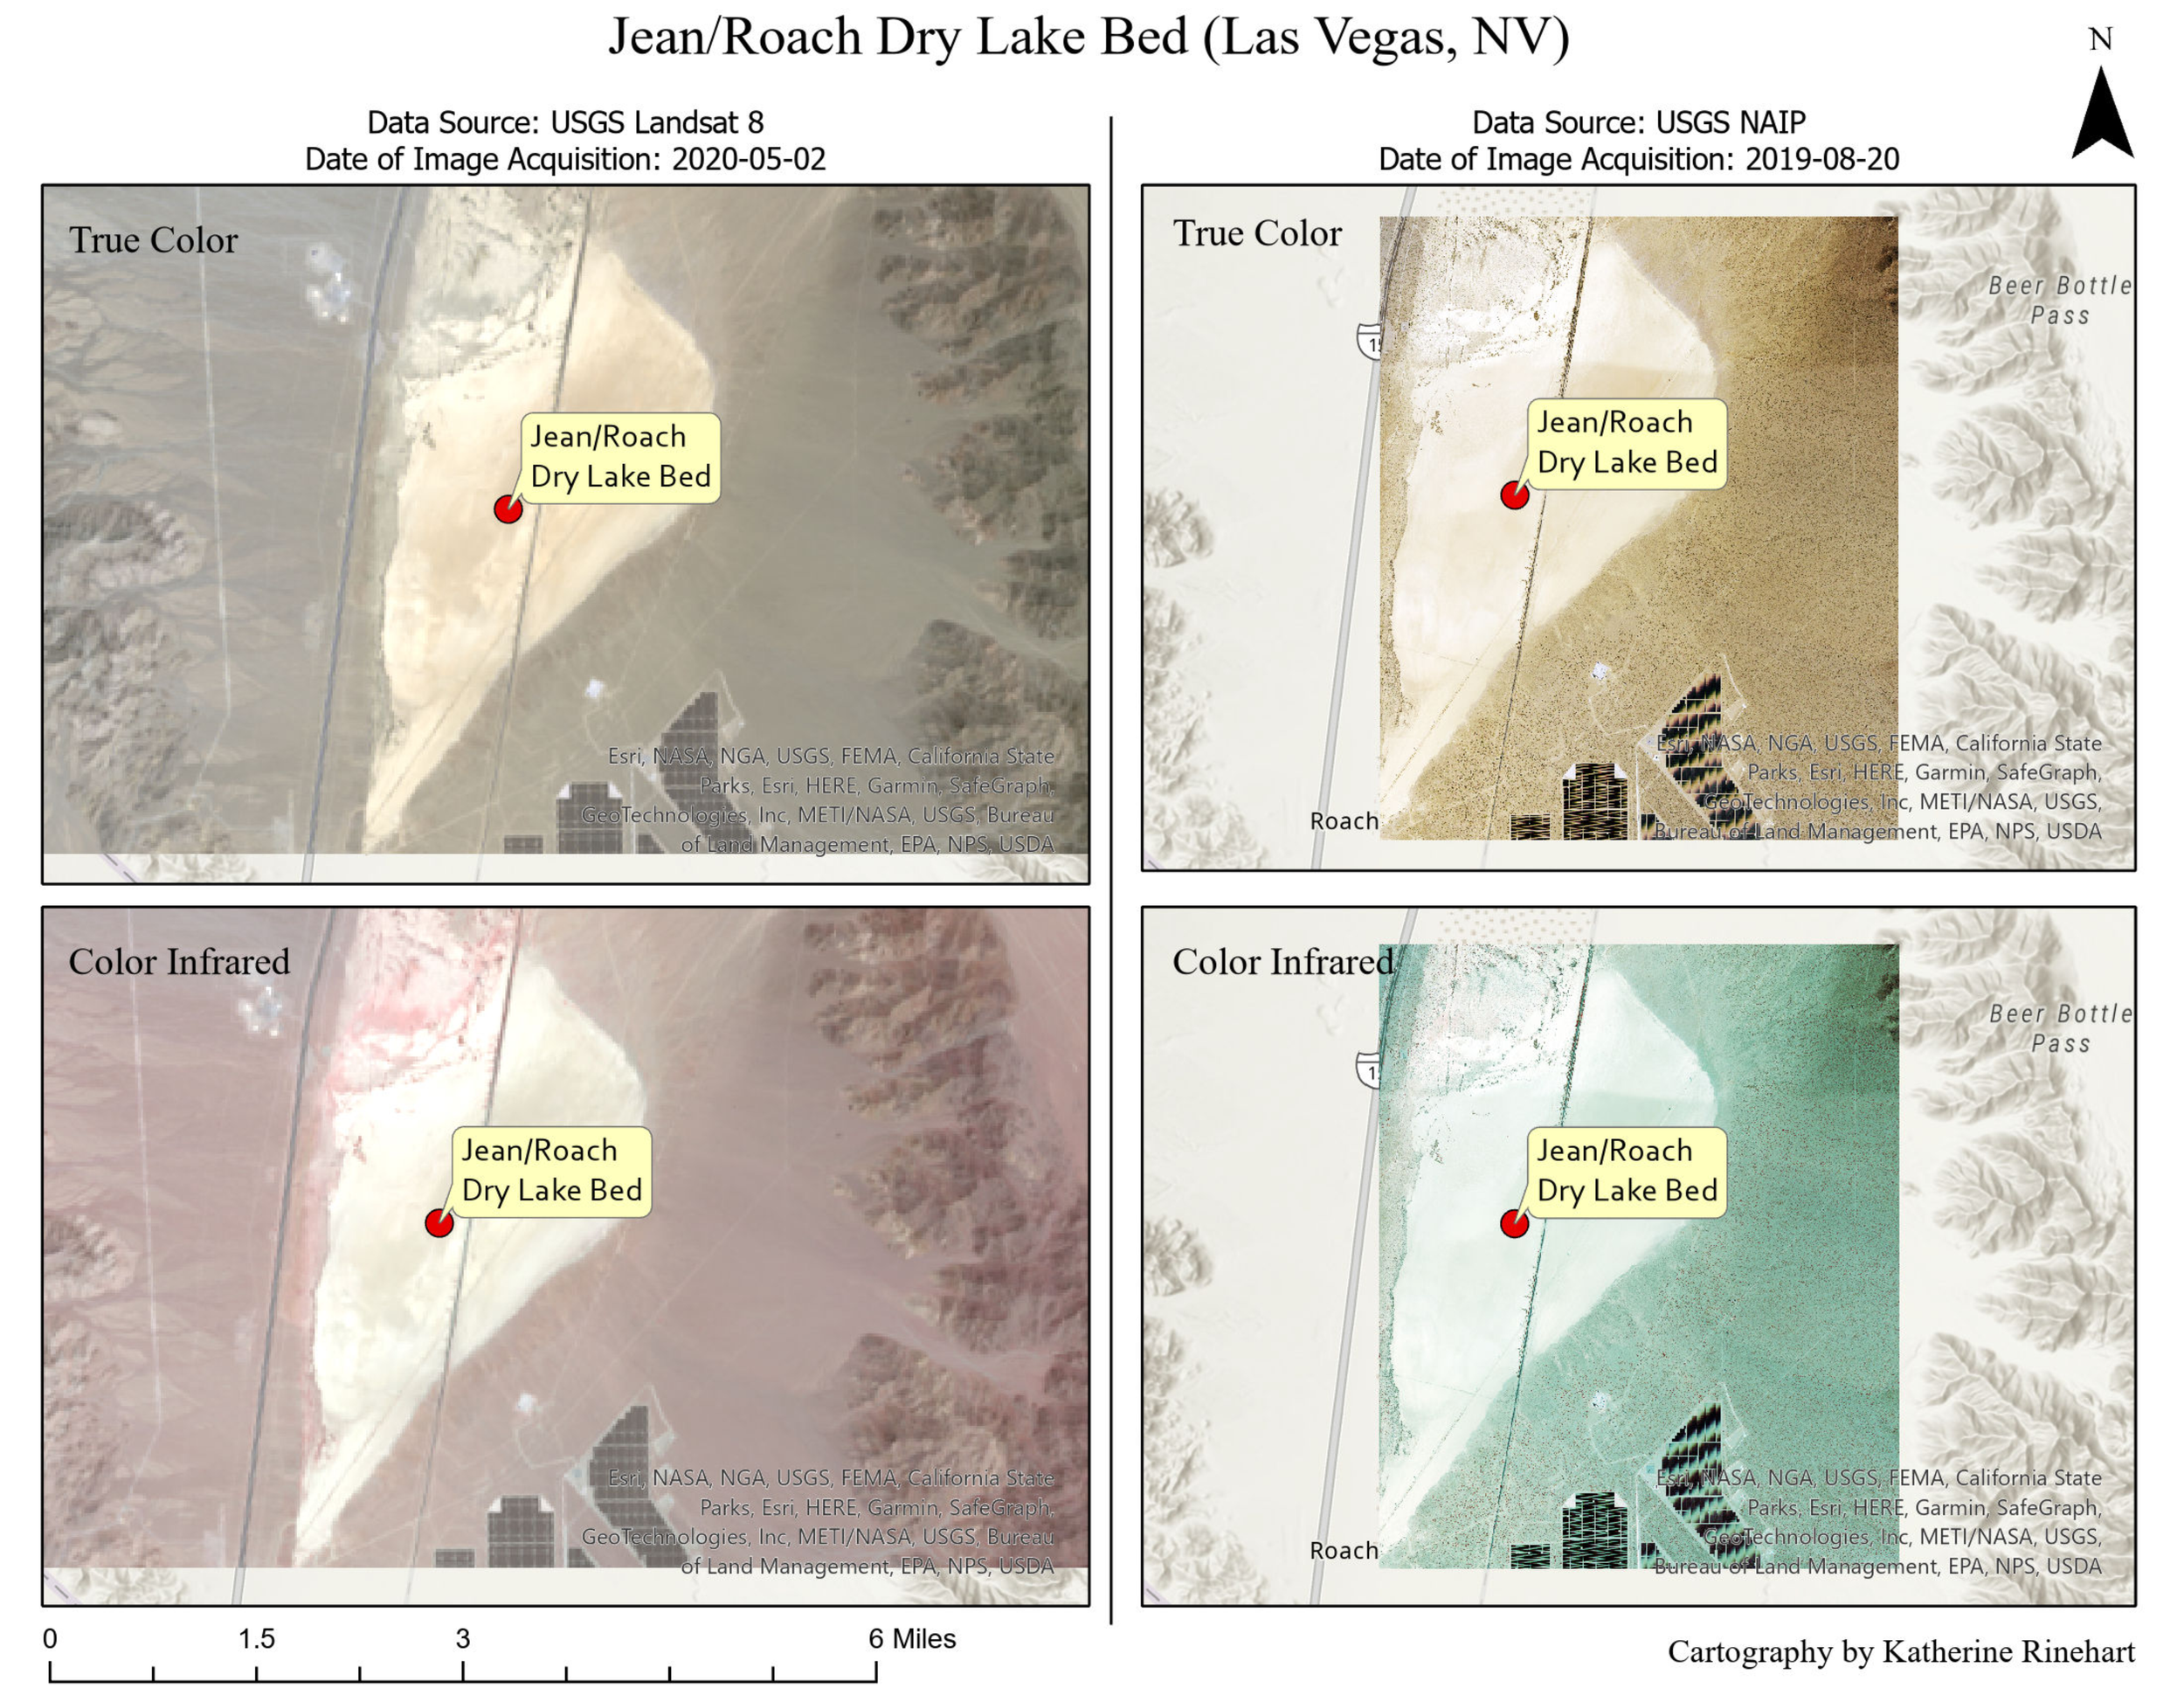
All satellite imagery was obtained using the USGS Earth Explorer (U.S. Geological Survey, 2023).
Landsat Metadata
Collection date: 2020-05-02
Raster format: Cloud Optimized GeoTIFF
Raster pixel depth: 16 Bit
Number of bands: 11
Projection: Transverse Mercator
Coordinate System: WGS 1984 UTM Zone 11
NAIP Metadata
Collection date: 2017-06-13
Raster format: Cloud Optimized GeoTIFF
Raster pixel depth: 8 Bit
Number of bands: 4
Projection: Transverse Mercator
Coordinate System: NAD 1983 UTM Zone 11N

True Color (Natural) Composite

False Color (Urban) Composite

Color Infrared (Vegetation) Composite

Land/Water Composite
The Science Behind Satellite Imagery: Exploring Landsat Band Composites
-
A true color (natural color) Landsat composite image utilizes bands 4, 3, and 2.
Jean/Roach Dry Lakebed
Color: Tan/Light Brown
The dry lakebed appears tan or light brown within the true-color composite due to the minerals that make up the lakebed (Okin, 2022). The spectral profile of the lakebed, when comparing portions of the true color Landsat 8 image, shows that the darker regions have the lowest reflectance for all three bands compared to the lighter regions of the soil/sand composition. The darker regions of the lakebed could be attributed to different minerals making up the primary components of the soil/sand (Okin, 2022). Conversely, the darker color representation within the lakebed could also potentially be attributed to a higher amount of soil moisture in these locations, as higher soil moisture would result in a lower spectral reflectance (or Brightness Value/Digital Number/Radiance) (Jensen, 2016; Okin, 2022). Furthermore, the size of the sand particles in the dry lakebed could vary between the lighter and darker shades of brown/tan (Okin, 2022). Variations in shade are due to larger particles scattering less light than smaller particles that scatter more light (Okin, 2022).
Lake Meade
Color: Dark to medium blue
Lake Meade appears primarily as a dark shade of blue within the true color composition due to water's absorption of longer wavelengths in the red and green regions of the electromagnetic spectrum (NASA, n.d.; Jensen, 2016; Okin, 2022). The result is that water reflects short wavelengths (i.e., blue and sometimes green) (NASA, n.d.).
McCarran International Airport
Color: Grey
When presented in true-color composition, concrete structures, such as airports and tarmacs, will appear grey due to the reflection of "35% of the incident energy in the blue, green, and red parts of the spectrum" (Jensen, 2016). Another potential cause for concrete's light grey appearance could be its fine grain size. The finer the grains in the material composition are, the brighter the reflectance compared to courser grain sizes (Okin, 2022).
TPC Las Vegas Golf Course
Color: Medium Green
The golf course appears as a medium green tone in the true-color composition because the vegetation contained within golf courses (i.e., grass) is well maintained and receives ample water. Healthy vegetation appears green, while unhealthy or stressed (i.e., lacking water) vegetation appears brown or yellow (Jensen, 2016; Okin, 2022). The reason behind these divergent presentations is that chlorophyll electronically absorbs strongly in the blue and moderately in the red wavelengths while not absorbing a comparatively significant amount within the green wavelength (Jensen, 2016; Okin, 2022). A healthy plant with chlorophyll and high-water contents will reflect green wavelengths (Jensen, 2016; Okin, 2022). Conversely, a stressed plant with low water content will have a stronger reflectance in the red and blue wavelengths creating the yellow/brown color in the true-color composition of unhealthy vegetation (Okin, 2022).
-
A false color (Urban) Landsat composite image utilizes bands 7, 6, and 4.
Jean/Roach Dry Lake Bed
Color: Bright Yellow/Verging on white
The Short-Wave Infrared presents vegetation similarly to NDVI; however, vegetation is presented in shades of green instead of red (GISGeography, 2022; Jensen, 2016). The brightness of the lake bed is due to the high surface reflectance of bare soil in the SWIR1 band (Zhao & Zhu, 2022). Within this band combination, "soils have various shades of brown" (GISGeography, 2022). The shades of brown attributed to the soil in this combination could be attributed to vibrational absorptions, as seen with carbonates and clay, or the electronic absorption seen with iron oxides (Okin, 2022). The shades could equally be attributed to the size of the soil particles increasing the overall scattering and reflectance (Okin, 2022).
Lake Meade
Color: Dark, dark blue/Black
Lake Meade appears to be deep blue or black in this combination due to the fact that "Water absorbs more energy (low reflectance) in NIR and SWIR wavelengths, while non-water reflects more energy (high reflectance)" (Mondejar & Tongco, 2019).
McCarran International Airport
Color: Pink/Purple/Blue
The artificial features of the airport runway and buildings appear bright pink/purple/blue due to the small grain size generating high light reflectance (GISGeography, 2022; Okin, 2022). The airport buildings have a high DN value and brightness due to the high surface reflectance of bright roofs in the Red and SWIR1 bands of Landsat 8 (Zhao & Zhu, 2022). Concrete reflects high in the SWIR bands (especially SWIR2), with little absorption (Zhao & Zhu, 2022). An additional consideration includes the age of the concrete or asphalt that the tarmac is composed of, as high reflectance occurs in aged, artificial pavement which has experienced asphalt erosion (Kumar Reddy et al., 2021).
TPC Las Vegas Golf Course
Color: Light Green with some Dark Green pixels
Within the False-Color Urban band combination, "darker shades of green indicate denser vegetation, sparse vegetation has lighter shades" (GISGeography, 2022). The darkness of the green shade is also impacted by the water content within the vegetation (NASA, 2014). Similar to how NDVI analysis works, this band combination can assist in assessing vegetation prominence, coverage, and health. Vegetation reflectance in the SWIR1 band is higher than in the Red and SWIR2 bands of Landsat 8 (Hively et al., 2021).
-
A color infrared (vegetation) Landsat composite image utilizes bands 5, 4, and 3.
Jean/Roach Dry Lake Bed
Color: Bright grey and varying grey tones
Soil has a surface reflectance of around 20% in the NIR, around 15% in the Red band, and closer to 10% in the Green band of Landsat 8 (Hively et al., 2021). The soil absorbs these wavelengths and generates very little surface reflectance compared to vegetation's surface reflectance, which is highest in the NIR band at over 40% (Hively et al., 2021). Because soil absorbs relatively high percentages of these bands and reflects low percentages, it presents with a greyish coloring in this band combination (WorldOfTech, 2021). The brightness could be attributed to the grain size of the soil/sand that composes the lake bed (Okin, 2022).
Lake Meade
Color: True Blue
Water absorbs highly and reflects minimally in the NIR, Red, and Green bands of Landsat 8 (Mondejar & Tongco, 2019). The surface reflectance values of the NIR and Red bands are around 5% and around 7% or 8% for the Green band (Mondejar & Tongco, 2019). The water feature appears dark compared to comparatively high surface reflectance values of "non-water" features in these bands (Mondejar & Tongco, 2019).
McCarran International Airport
Color: Grey and White
Similarly to the reasoning for the appearance of the lake bed and lake in these bands, the low surface reflectance of artificial materials (such as concrete and asphalt) in the NIR, Red, and Green bands of Landsat 8 result in its grey/white appearance seen in this band combination (Mondejar & Tongco, 2019; WorldOfTech, 2021).
TPC Las Vegas Golf Course
Color: Red
Vegetation reflects highly in the NIR band of Landsat 8 at over 40% reflectance (Hively et al., 2021). The surface reflectance seen in this band for the vegetation category is the highest of any of the Landsat 8 bands (Jensen, 2016). The scattering effect is prominent within the NIR band wavelength, as there is little light absorption (Okin, 2022). In the Green band, some reflectance is present due to vegetation electronically absorbing high amounts of light in the Red and Blue wavelengths and bands of Landsat 8 (Okin, 2022).
-
A land/water Landsat composite image utilizes bands 5, 6, and 4.
Jean/Roach Dry Lake Bed
Color: White and light green
This band combination accentuates the image's differences between land and water (EOS, 2022). Soil's relatively high reflectance and low absorption of light in the NIR and SWIR1 bands compared to the feature's values in the other Landsat 8 bands, accompanied by the vegetation's high absorption in the Red band wavelengths, allows for the differentiation of soil and vegetation (EOS, 2022; Hively et al., 2021). Similarly to the other considerations when discussing soil reflectance, the grain size and chemical composition of the soil/sand present within the lake bed could contribute to the brightness and variation in soil seen throughout the feature (Okin, 2022).
Lake Meade
Color: Dark Blue
Because water absorbs greatly in the NIR and SWIR1 bands of Landsat 8, the water region of the image is highly differentiated from the land features (EOS, 2022). Variations in water depth result in the variations of color presentation seen throughout the lake, ranging from dark blue to lighter blue, with the lighter portions attributed to a shallower depth (EOS, 2022).
McCarran International Airport
Color: Purple tarmac and Green between dirt
Concrete and asphalt both have high reflectance and lower absorption in the NIR and SWIR1 band wavelengths allowing for the stark contrast between these features and the highly absorbent water features of the image (Quinn, 2001). The water sensitivity of the SWIR1 and NIR bands, accompanied by the Red band's "strong chlorophyll absorption region and strong reflectance region for most soils," also allows for the differentiation between these artificial features and the vegetation (EOS, 2022; Quinn, 2001).
TPC Las Vegas Golf Course
Color: (dirt surrounding is light green) grass is bright orange
Vegetation's high surface reflectance and low absorption in the NIR, accompanied by the SWIR1 band's ability to monitor the health of vegetation, results in the bright orange color seen in the golf course for this combination (EOS, 2022; Jensen, 2016; Quinn, 2001). As previously mentioned, golf courses and their greens are well maintained and receive ample amounts of water, which maintain the health of the vegetation present and results in the bright orange color present.

Lake Meade
Jean/Roach Dry Lakebed

McCarran International Airport

TPC Las Vegas Golf Course
Comparing Satellite Imagery Sources and Determine Appropriate Usage: Landsat and NAIP
-
“Temporal resolution is defined as the amount of time needed to revisit and acquire data for the exact same location” (Springer, 1970). The NAIP temporal resolution is 3 years, and the Landsat 8 temporal resolution is 16 days (USGS, n.d.). As a result, the Landsat 8 satellite has a higher temporal resolution than the NAIP satellite.
-
The NAIP images downloaded for this project have spatial resolutions, or cell size, of 0.6 by 0.6 m. The Landsat 8 images downloaded for the same purposes have a 30 by 30 m spatial resolution. The NAIP images’ higher spatial resolution is also easily seen by zooming into both images, side by side, and viewing the zoom level or extent at which features are no longer easily distinguishable or become highly pixelated. It is important to consider spatial resolution needs when determining which source to gather remotely sensed images from, as a low spatial resolution can hinder analyses.
-
“Spectral resolution describes the ability of a sensor to define fine wavelength intervals. The finer the spectral resolution, the narrower the wavelength range for a particular channel or band” (Natural Resources Canada, 2015). The NAIP images have a spectral resolution of four bands containing Red, Green, Blue, and NIR wavelengths (NAIP & USDA, 2011). The Landsat 8 images contain a spectral resolution of 11 bands containing Coastal, Blue, Green, Red, NIR, SWIR1, SWIR2, Pan, Cirrus, TIRS1, and TIRS2 wavelengths (Landsat Missions, n.d.). Therefore, the Landsat 8 satellite and resulting images have a higher spectral resolution than the NAIP images.
-
Landsat 8 would be a more appropriate image source choice than NAIP when conducting a change detection analysis over a brief period. For example, conducting an NDVI analysis of the Santa Monica Mountains immediately prior to and after the Woolsey Fire in 2018 would require the use of Landsat 8 imagery as the NAIP imagery would perhaps not have been captured close enough to before the fire or soon enough after the fire to be relevant or significant in the analysis.
Another circumstance in which Landsat 8 imagery rather than NAIP is more appropriate would be when analyzing drought-related water loss in the Las Vegas area between 2020 and 2022. One reason the use of NAIP imagery would not be appropriate for this circumstance is the issue of low temporal resolution. Another issue with the NAIP imagery is the comparatively low spectral resolution which does not include SWIR1, SWIR2, or TIRS bands that would prove useful in creating images showing stark definition and differentiation between water and land. The stark differentiation of these features is imperative to the analysis of receding shorelines or water levels.
A circumstance in which NAIP imagery would be more appropriate than Landsat 8 imagery is the change detection analysis of a newly developed subdivision at very high spatial resolution. The NAIP imagery would allow for statistical analysis of smaller plots of land instead of the Landsat 8 imagery, which would only facilitate the analysis at the maximum level of 30 meters of spatial resolution.
Another instance in which NAIP imagery would be more appropriate than Landsat 8 imagery would be the analysis of deforestation or tree mortality. If one were to investigate the tree mortality in the Santa Monica Mountains resulting from the invasion of the Gold Spotted Oak Borer and wanted to assess and document the loss of specific trees via a combination of remote sensing and ground surveys, one would need the NAIP imagery due to its much higher spatial resolution.
References
ArcGIS Pro. (n.d.). Raster file formats. Raster file formats-ArcGIS Pro | Documentation. Retrieved October 7, 2022, from https://pro.arcgis.com/en/pro- app/latest/help/data/imagery/supported-raster-dataset-file-formats.htm
EOS. (2022, July 27). Land and water bands usage in the satellite imagery. EARTH OBSERVING SYSTEM. Retrieved October 9, 2022, from https://eos.com/make-an- analysis/land- water/#:~:text=Band%20combination%3A%20NIR%20(4),shades%20of%20green%20and%20orange.
GISGeography. (2022, June 4). Landsat 8 bands and band Combinations. GIS Geography.
Retrieved October 7, 2022, from https://gisgeography.com/landsat-8-bands-combinations/
Hively, W. D., Lamb, B. T., Daughtry, C. S., Serbin, G., Dennison, P., Kokaly, R. F., Wu, Z., & Masek, J. G. (2021). Evaluation of swir crop residue bands for the Landsat Next Mission. Remote Sensing, 13(18), 3718. https://doi.org/10.3390/rs13183718
Jensen, J. R. (2016). Introductory Digital Image Processing: A Remote Sensing Perspective. Pearson Education.
Kumar Reddy, S. L., Rao, C. V., Kumar, P. R., G. Anjaneyulu, R. V., & Krishna, B. G. (2021). An index based road feature extraction from landsat-8 oli images. International Journal of Electrical and Computer Engineering (IJECE), 11(2), 1319. https://doi.org/10.11591/ijece.v11i2.pp1319-1336
Landsat Missions. (n.d.). Landsat 8. Landsat 8 | U.S. Geological Survey. Retrieved October 7, 2022, from https://www.usgs.gov/landsat-missions/landsat-8
Landsat User Services. (2022). Landsat—Earth Observation Satellites - USGS. U.S. Geological Survey. Retrieved October 3, 2022, from https://pubs.usgs.gov/fs/2015/3081/fs20153081.pdf
Mondejar, J. P., & Tongco, A. F. (2019). Near Infrared Band of landsat 8 as water index: A case study around Cordova and Lapu-Lapu City, Cebu, Philippines. Sustainable Environment Research, 29(1). https://doi.org/10.1186/s42834-019-0016-5
Mondejar, J. P., & Tongco, A. F. (2019). Near Infrared Band of landsat 8 as water index: A case study around Cordova and Lapu-Lapu City, Cebu, Philippines. Sustainable Environment Research, 29(1). https://doi.org/10.1186/s42834-019-0016-5
NAIP & USDA. (2011, March). National Agriculture Imagery Program (NAIP) - fsa.usda.gov. Retrieved October 9, 2022, from https://www.fsa.usda.gov/Internet/FSA_File/naip_2010_infosheet.pdf
NASA. (2014, March 4). Why is that Forest Red and that cloud blue? NASA. Retrieved October 9, 2022, from https://earthobservatory.nasa.gov/features/FalseColor/page5.php
NASA. (n.d.). Ocean Color. NASA. Retrieved October 7, 2022, from https://science.nasa.gov/earth-science/oceanography/living-ocean/ocean- color#:~:text=The%20red%2C%20yellow%2C%20and%20green,water%20molecules%20 in%20the%20ocean.
Natural Resources Canada. (2015, November 23). Spectral Resolution. Natural Resources Canada. Retrieved October 9, 2022, from https://www.nrcan.gc.ca/maps-tools-and-publications/satellite-imagery-and-air-photos/tutorial-fundamentals-remote- sensing/satellites-and-sensors/spectral-resolution/9393
Okin, G. (2022). Why do surfaces look different? Atmospheric and Geologic Materials . MAGIST 411. Retrieved October 7, 2022, from https://bruinlearn.ucla.edu/courses/141360/pages/411-dot-1-8-why-do-surfaces-look- different-atmospheric-and-geologic-materials-8-45?module_item_id=5376598.
Quinn, J. (2001). Band Combinations. Band combinations. Retrieved October 9, 2022, from https://web.pdx.edu/~nauna/resources/10_BandCombinations.htm
Springer. (1970, January 1). Temporal Resolution. SpringerLink. Retrieved October 9, 2022, from https://link.springer.com/10.1007%2F978-0-387-35973- 1_1376#:~:text=Temporal%20resolution%20is%20defined%20as,as%20well%20as%20se nsor%20characteristics.
USDA & APFO. (2011, April). Four Band Digital Imagery Information Sheet. USDA. Retrieved October 7, 2022, from https://www.fsa.usda.gov/Internet/FSA_File/fourband_info_sheet_2011.pdf
USDA & APFO. (2017, April). Four Band Digital Imagery Information Sheet. USDA. Retrieved October 7, 2022, from https://www.fsa.usda.gov/Assets/USDA-FSA- Public/usdafiles/APFO/support-documents/pdfs/fourband_infosheet_2017.pdf
USGS. (n.d.). How often is orthoimagery in the national map updated and what are the acquisition dates? How often is orthoimagery in The National Map updated and what are the acquisition dates? | U.S. Geological Survey. Retrieved October 9, 2022, from https://www.usgs.gov/faqs/how-often-orthoimagery-national-map-updated-and-what-are- acquisition-dates
WorldOfTech. (2021, December 22). Landsat 8 bands and band combinations: Learn gis.
WorldOfTech. Retrieved October 9, 2022, from https://www.worldofitech.com/landsat-8- bands-combinations/#Color_Infrared_5_4_3
Zhao, Y., & Zhu, Z. (2022). ASI: An artificial surface index for Landsat 8 imagery. International Journal of Applied Earth Observation and Geoinformation, 107, 102703. https://doi.org/10.1016/j.jag.2022.102703