Exploring Tabular and Raster Data Analysis and Management
Tabular Data Analysis and Management with SQL: Clark County, Nevada Voter Data
SQL in Tabular Data Analysis
SQL, or Structured Query Language, is a programming language used to manage and analyze tabular data. It enables efficient querying and manipulation of large datasets, making it ideal for voter registration analysis. Key SQL commands like SELECT, WHERE, GROUP BY, and JOIN allow for filtering, grouping, and combining data from multiple tables. With powerful functions and operators for calculations and transformations, SQL can uncover patterns, trends, and anomalies in voter registration data through advanced techniques like subqueries.
Benefits of SQL in Large Dataset Analysis
SQL plays a significant role in handling large datasets, making it an ideal tool for analyzing voter registration data. With SQL, you can efficiently query and manipulate data, filter and sort information to identify patterns, and perform complex joins and unions to merge multiple datasets. SQL also streamlines tasks like data cleaning and transformation, ensuring accuracy in voter registration analysis. Its scalability and compatibility with various database management systems make SQL a powerful tool for handling diverse voter registration datasets.
Application of PostgreSQL for Voter Data
PostgreSQL provides efficient data management and retrieval for voter registration data. Its powerful querying capabilities allow for complex analysis, identifying trends and patterns. The flexibility of PostgreSQL enables easy integration with other tools in the voter registration process. Leveraging its security features ensures data protection and integrity. With scalability, PostgreSQL handles large volumes of voter registration data. Advanced features like indexing and partitioning optimize data retrieval and enhance performance.
The Data
The voter registration data from Clark County, Nevada contains various information such as name, address, party affiliation, and registration status. Each entry in the data represents an individual voter registered in Clark County. Organized in a tabular format, with columns representing different variables and rows representing individual voters, the structure of the data facilitates easy sorting, filtering, and analysis of voter registration information. This structured format enables accurate and efficient analysis of voter registration trends and patterns.
Voter List File Layout
Voter List Code Reference
(Clark County Nevada, 2021).
SQL Queries
SQL queries are listed below each data summary goal and can be accessed by expanding the associated accordion tab using the down arrows.
-
select count(*) from voters
group by assembly
order by assembly asc;
-
select count(*) from voters
group by senate
order by senate asc;
-
select 2022 - avg(birth_year) avg_age from voters;
-
select party_reg, 2022 - avg(birth_year) avg_age from voters
group by party_reg;
-
select first_name, middle_name, last_name, sex from voters;
-
select count(phone_num) as Total_Voters,
count(phone_num) filter(where phone_num != '') as Num_W_Phone,
count(phone_num) filter(where phone_num = '') as Num_Without_Phone,
(100 * count(phone_num) filter(where phone_num != '') / count(*)) asPct_W_Phone_Num,
(100 * count(phone_num) filter(where phone_num = '') / count(*)) asPct_No_Phone_Num
from voters;
-
select count(*) as Total_Voters,
count(party_reg) filter(where party_reg = 'DEM') as Num_DEM,
count(party_reg) filter(where party_reg = 'REP') as Num_REP,
count(party_reg) filter(where party_reg = 'INA') as Num_INA,
count(party_reg) filter(where party_reg = 'NP') as Num_NP,
count(party_reg) filter(where party_reg = 'OTH') as Num_OTH,
count(party_reg) filter(where party_reg = 'LIB') as Num_LIB,
(100 * count(party_reg) filter(where party_reg = 'DEM') /count(*)::numeric(12,4)) as Pct_DEM,
(100 * count(party_reg) filter(where party_reg = 'REP') /count(*)::numeric(12,4)) as Pct_REP,
(100 * count(party_reg) filter(where party_reg = 'INA') /count(*)::numeric(12,4)) as Pct_INA,
(100 * count(party_reg) filter(where party_reg = 'OTH') /count(*)::numeric(12,4)) as Pct_OTH,
(100 * count(party_reg) filter(where party_reg = 'LIB') /count(*)::numeric(12,4)) as Pct_LIB
from voters;
-
select commission, party_reg, count(party_reg)
from voters
where commission != ''
group by commission, party_reg
order by commission asc, count desc;
-
select registration_num, assembly, senate, commission, assembly.memberassembly_member,
assembly.member_party assembly_member_party, senate.membersenate_member,
senate.member_party senate_member_party, commission.member_partycommission_member_party,
commission.member commission_member
from voters
left join assembly on voters.assembly = assembly.district
left join senate on voters.senate = senate.district
left join commission on voters.commission = commission.district
order by random() limit 1;
-
select last_name,
count(last_name) as name_occurrence
from voters
group by last_name
order by name_occurrence desc
limit 20;
-
select first_name, count(first_name) as occurrance
from voters
group by first_name
order by occurrance asc;
-
select count(*) voters, assembly.member_partydistrict_assembly_member_party
from voters
left join assembly on voters.assembly = assembly.district
where assembly.member_party = 'Democratic' or assembly.member_party ='Republican'
group by assembly.member_party;
-
select count(*) as voters_voting_in_at_least_one_election
from voters
where election1 != '' or election2 != ''or election3 != '' or election4 != '' orelection5 !=''
or election6 != '' or election7 != '' or election8 != ''or election9 != '' or election10!= ''
or election11 !='' or election12 != '' or election13 != '' or election14 != ''orelection15 != ''
or election16 != '' or election17 !='' or election18 != '' or election19 != '' orelection20 != '';
-
select count(*) as voters_w_mail_address_outside_NV
from voters
where mail_state != 'NV';
-
select mail_state,
count(mail_state) as occurrance
from voters
where mail_state != 'NV'
group by mail_state
order by occurrance asc;
-
update voters
set party_reg = ['updated_party']
where registration_num = ['voter_reg_number'];
-
update voters
set first_name = ['updated_name']
where registration_num = ['voter_reg_number'];
-
update voters
set mail_address = ['updated_address']
where registration_num = ['voter_reg_number'];
-
update voters
set phone_num = ['updated_phone_number']
where registration_num = ['voter_reg_number'];
-
delete from voters
where registration_num = ['voter_reg_number'];
Raster Data Analysis and Management with PostGIS
PostGIS in Raster Data Analysis and Management
PostGIS is a powerful tool for handling raster data, such as land cover, population, and city data. Understanding the dynamics of these factors is crucial in various domains, including urban planning, environmental monitoring, and demographic analysis. To prepare land cover, population, and city data for PostGIS, start by obtaining the required raster data for California. Import the data into PostGIS using the raster2pgsql tool. Utilize spatial queries to manipulate and analyze the raster data.
Benefits of PostGIS in Raster Dataset Analysis
PostGIS offers powerful capabilities for analyzing tabular data and performing statistical analysis. In the context of land cover, population, and city data in California, you can utilize SQL queries to extract relevant data from PostGIS and conduct various analyses. PostGIS also offers powerful capabilities for analyzing tabular data and performing statistical analysis. In the context of land cover, population, and city data in California, you can utilize SQL queries to extract relevant data from PostGIS and conduct various analyses.
The Data
The land cover raster data for California was obtained from the USGS and contains codes which correspond to landcover types. Population raster data was sourced from the Socioeconomic Data and Applications Center containing cells with population values, California was subsequently extracted from this data for individual use. Vector data for California cities, towns, and census-designated places (CDPs) was obtained from the U.S. Census Bureau for the year 2020. A digital elevation model raster file for the California Central Coast was sourced from NOAA.
Land Cover Codebook
SQL Queries
SQL queries are listed below each data summary goal and can be accessed by expanding the associated accordion tab using the down arrows.
-
select st_value(rast, pt.geom) landcover_code
from landcover,
lateral ( select st_transform(st_setsrid(st_point(-118.6031198,34.2145558),4326), 5072) as geom ) pt
where st_intersects(geom,rast);
-
select st_value(rast, pt.geom) landcover_code,
(select landuse_ecosystem landcover_description from landcover_descwhere cast(st_value(rast, pt.geom) as text) = landuse_code)
from landcover,
lateral ( select st_transform(st_setsrid(st_point(-118.6031198,34.2145558),4326), 5072) as geom ) pt
where st_intersects(geom,rast);
-
select
round((st_summarystats(st_clip(population.rast, cities_towns.geom,true))).sum::numeric, 3) as population,
cities_towns.name as name
from
population, cities_towns
where st_intersects(cities_towns.geom, population.rast)
order by population desc nulls last;
-
select
round((st_summarystats(population.rast)).sum::numeric, 3) aspopulation
from
population,
lateral (selectst_union(st_buffer(st_transform(st_setsrid(st_point(-118.6031198,34.2145558), 4326), 5072), 5000.03)) as geom) pt
where st_intersects(geom,rast);
-
Note: With a Value of 1 for Areas Above Sea Level (Elevation Greater Than Zero), and a Value of 0 for Areas at or Below Sea Level
create table public.centralcoast_sealevelreclass as
select rid, st_reclass(rast,1, '[-1-0]:0, 0-5000:1', '8BUI') as rast
from centralcoast_elevation;
vacuum analyze centralcoast_sealevelreclass;
create index centralcoast_sealevelreclass_idx oncentralcoast_sealevelreclass using gist(st_convexhull(rast));
-
Note: Create a Table With a Value of 1 for Thoseareas Higher Than 10 Feet Above Sea Level (Elevation Greater Than 10), Anda Value of 0 for Those Areas at or Below an Elevation of 10 Feet
create table public.centralcoast_tsunami_hazard as
select rid, st_reclass(rast,1, '10-5000: 1, [-1-10]:0','8BUI') as rast
from centralcoast_elevation;
vacuum analyze centralcoast_tsunami_hazard;
create index centralcoast_tsunami_hazard_idx oncentralcoast_tsunami_hazard using gist(st_convexhull(rast));
-
create table centralcoast_slope2 as
select st_slope(st_union(rast)) as rast from centralcoast_elevation;
vacuum analyze centralcoast_slope2;
create index centralcoast_slope_idx on centralcoast_slope2 usinggist(st_convexhull(rast));
-
Note: Reclassify the Slope of the Dem, Showing Areas of High Slope (Slopes Greater Than or Equal to 30) With Ascore of 1 and Areas Without High Slope (Slopes Less Than 30) With a Score of 0
create table centralcoast_slope_reclass3 as
select st_reclass(st_union(rast),1, '[30-60]:1, 0-30:0', '8BUI') as rast fromcentralcoast_slope2;
vacuum analyze centralcoast_slope_reclass;
create index centralcoast_slope_reclass_idx oncentralcoast_slope_reclass using gist(st_convexhull(rast));
-
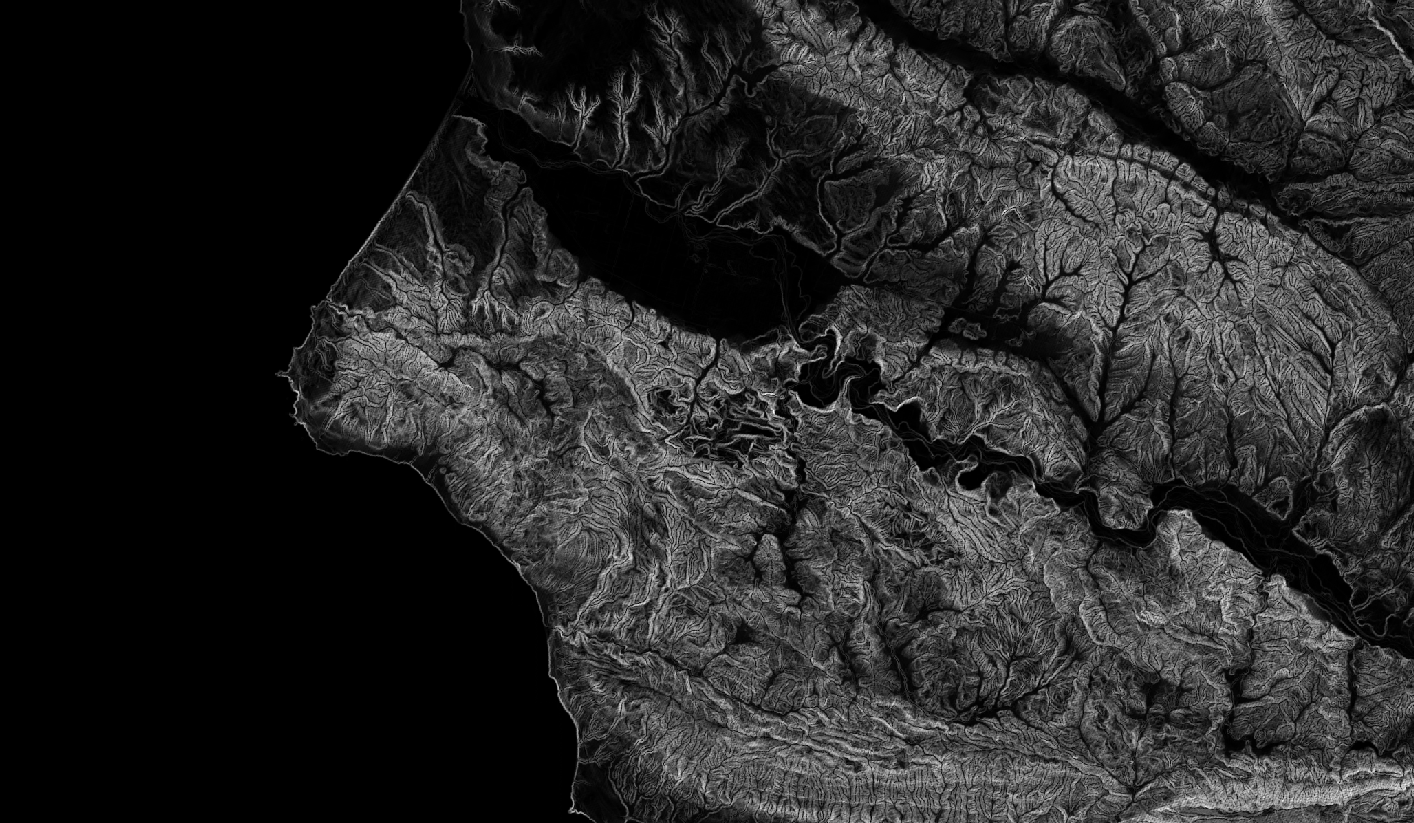
create table centralcoast_hillshade7 as
select st_hillshade(st_union(rast)) as rast
from centralcoast_elevation;
vacuum analyze centralcoast_hillshade7;
create index centralcoast_hillshade_idx on centralcoast_hillshade7 usinggist(st_convexhull(rast));
References
Clark County Nevada. (2021). Voter List Data Files Clark County, NV. Clark County Nevada. https://www.clarkcountynv.gov/government/departments/elections/reports_data_maps/voter_list_data_files.php
USGS. (2019). Land Cover Data Download | U.S. Geological Survey. USGS. https://www.usgs.gov/programs/gap-analysis-project/science/land-cover-data-download?qt-science_center_objects=0#qt-science_center_objects